Jack & Jill Bakery Line Graph
Worksheet Description
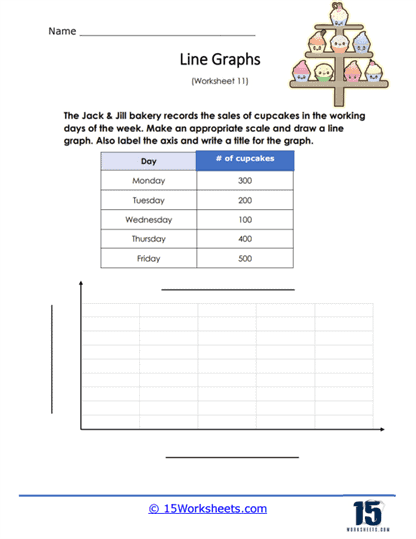
The Jack & Jill bakery are master cupcake bakers. They recorded all the cupcake sales for this past week. The data can be found in the data table. Use that data to create a line graph. Make sure to choose an appropriate scale, label each axis, and title the graph.
This worksheet is a mathematics educational resource focusing on line graphs. It presents a scenario where the Jack & Jill bakery records the sales of cupcakes over the working days of the week. Students are instructed to create a line graph based on the provided data, which details the number of cupcakes sold from Monday to Friday. The task also includes labeling the axes and writing a title for the graph, enhancing the students’ ability to interpret and present data visually.
The worksheet aims to teach students how to translate numerical data into a visual representation using a line graph. It introduces the concept of scaling on the graph to accommodate different data values, which is a fundamental skill in graphing. By asking students to label the axes and title the graph, it reinforces the importance of clear communication in data presentation. Furthermore, the exercise helps to develop analytical skills as students observe trends in the data, such as which days had higher or lower sales.