Volunteer Line Graph
Worksheet Description
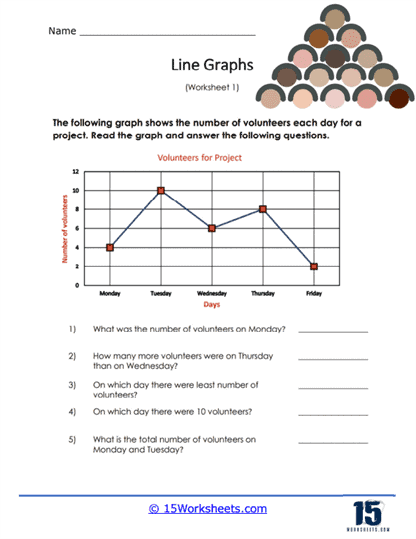
A group of volunteers helped the local community for a week. This graph indicates the total number of people that helped out each day of the week. Answer the questions based on the data in the line graph.
This worksheet features a line graph that tracks the number of volunteers each day for a project from Monday to Friday. The graph provides points for each day, connected by lines to show the change in volunteer numbers throughout the week. Students are instructed to read the graph and answer questions related to specific data points, such as determining the number of volunteers on a given day, comparing volunteer numbers between days, identifying the day with the least number of volunteers, and calculating the total number of volunteers over a period of days.
The worksheet is designed to teach students how to interpret and extract information from a line graph. It encourages them to observe trends, make comparisons between different points, and perform simple additions based on the data provided. The activity helps students practice using line graphs as a tool for data visualization and analysis. By completing the worksheet, students will enhance their understanding of how to use graphs to represent and reason with real-world data.