Height in Inches
Worksheet Description
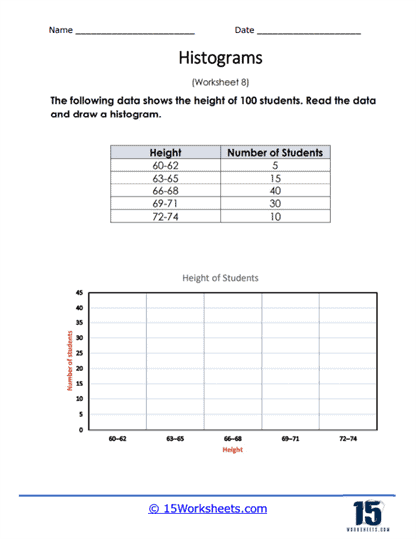
A frequency chart was created based on the height of students in inches. Take this data and create a histogram to visualize the data.
This worksheet is centered around the concept of creating a histogram from given height data for a group of 100 students. The data is organized into a table with height ranges as categories and the number of students in each height range as the frequency. Students must use this data to draw a histogram on the provided axes, plotting the number of students on the vertical axis against their height range on the horizontal axis. The goal is to convert the tabular data into a visual representation that clearly shows the distribution of student heights.
The worksheet teaches students how to interpret data from a frequency distribution table and translate it into a histogram, a fundamental skill in data representation. It helps students understand how to determine the scale and draw bars corresponding to the frequency of data within specific ranges. By creating the histogram, students learn to visualize the distribution of a data set, making it easier to see patterns such as the most common height range. This skill is valuable for analyzing and presenting data in a clear and understandable manner.