State Population Distribution
Worksheet Description
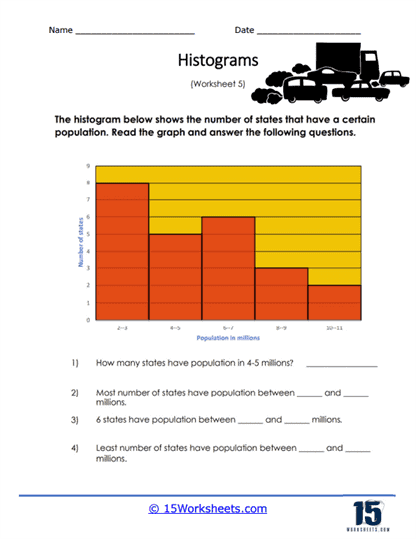
This histogram displays the population (in the millions) of various states. Interpret this data to help you answer all of the questions.
The worksheet features a histogram that displays the distribution of the population across various states within certain ranges. The population ranges are grouped into categories, and the histogram bars represent the number of states that fall into each population category. Students are tasked with interpreting the histogram to determine the number of states within specific population ranges, identify the range with the most and least states, and find how many states fall into a given population category.
The worksheet teaches students how to read and interpret data from a histogram, a critical skill in statistics and data analysis. It encourages students to understand frequency distributions and to extract meaningful information from grouped data. The exercise also reinforces numerical comparison and deduction skills, as students must analyze the height of the bars to answer the questions. By completing this worksheet, students will enhance their ability to work with and understand graphical representations of data.