Text Message Histogram
Worksheet Description
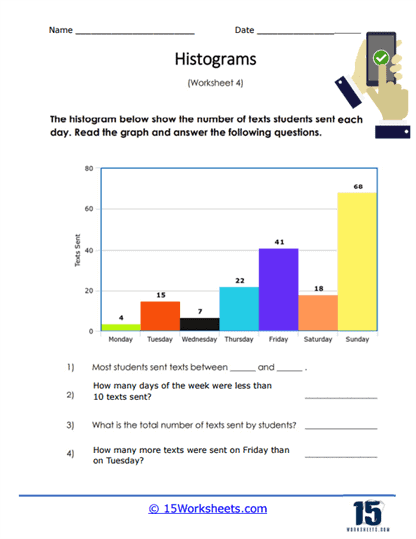
A histogram is provided that displays the number of text messages that students sent out over the course of a week. Use this data to answer the critical thinking questions that are found at bottom of the page.
The worksheet includes a histogram that represents the number of text messages sent by students on each day of the week. Students are asked to analyze the data shown on the histogram to answer questions about texting habits. The questions range from identifying the days with the most and least texts sent to calculating the total number of texts sent in a week. Additionally, the worksheet prompts students to compare the number of texts sent on different days.
This worksheet is designed to teach students how to extract and compare data from a histogram, a graphical representation of distribution. It encourages students to observe patterns and draw conclusions from the data, such as determining which days are more active for texting. The tasks help students to practice basic arithmetic skills, such as addition and subtraction, in the context of analyzing real-world data. Overall, the worksheet aims to enhance students’ ability to interpret data visually and apply mathematical operations to answer questions based on the information provided.