Car Accident Histogram
Worksheet Description
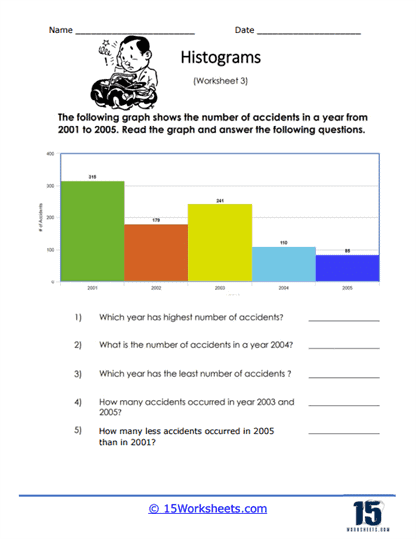
This histogram displays the number of car accidents that occurred locally over a period of 5 years. Answer all the questions based on the data that is being shown.
The worksheet presents a histogram detailing the number of accidents for each year from 2001 to 2005. Students are tasked with analyzing the histogram to answer questions regarding the data it represents. The questions focus on identifying the year with the highest and lowest number of accidents, determining the exact number of accidents in specific years, and calculating the difference in the number of accidents between two given years.
This worksheet is aimed at teaching students how to read and interpret data from a histogram, a skill that is essential for understanding statistical information. By responding to the questions, students learn how to extract numerical information from a graphical representation, compare data across different categories, and perform simple subtraction operations to determine changes over time. This type of exercise helps students to develop critical thinking skills and become proficient in handling and analyzing real-world data sets.