Laptops Sold
Worksheet Description
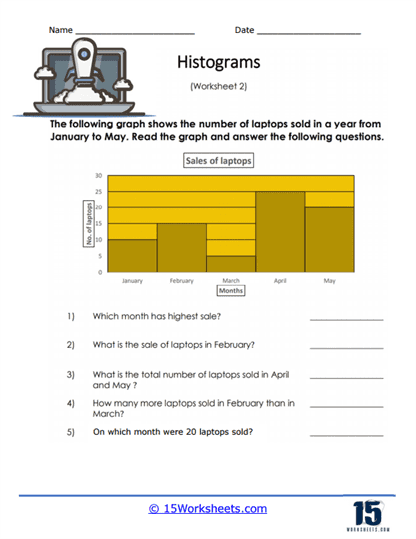
You will look at the sales of laptops at a store over a series of five months. You are given questions that you should answer based on the histogram that is provided.
The worksheet features a histogram that illustrates the number of laptops sold each month from January to May. The purpose of the worksheet is for students to use the histogram to answer specific questions related to the data displayed. The questions probe the students’ ability to identify which month had the highest sales, the exact number of sales in a given month, cumulative sales for certain months, and comparisons between sales in different months.
This worksheet is teaching students how to interpret and analyze data presented in a histogram. It guides them in reading and understanding graphical data representations, extracting specific information, and performing basic arithmetic operations based on the data. The questions encourage critical thinking about the data, such as comparing values and identifying patterns or trends. The skills learned from this worksheet are fundamental to data literacy and are applicable in various academic disciplines and real-world situations.