Age Group Frequency
Worksheet Description
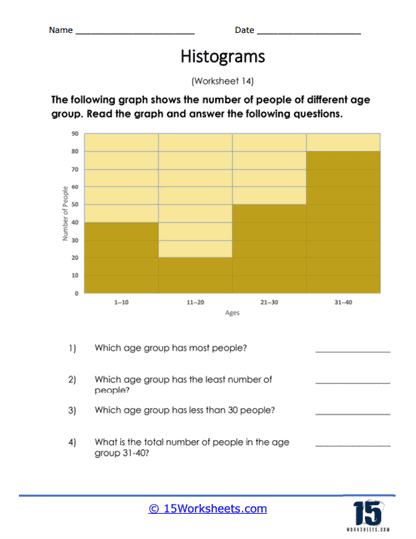
A researcher collects the ages of a group of people in the mall on a particular day. Use the data in the histogram to break down these questions.
This worksheet includes a histogram that shows the distribution of a population across different age groups. The histogram’s horizontal axis is labeled with age groups in intervals, while the vertical axis represents the number of people in each of these age groups. Students are tasked with analyzing the histogram to answer questions regarding which age group has the most or least number of people, identifying age groups with a population below a certain threshold, and calculating the total number of people within a specific age range.
The worksheet is designed to teach students how to read and interpret data presented in a histogram. It emphasizes the skill of extracting specific information from a graphical representation, such as determining the size of different groups within a set of data. The questions guide students to practice comparative analysis and simple arithmetic based on the data provided in the histogram. Through this activity, students develop their ability to analyze demographic data and enhance their understanding of graphical data representation.