Books Sold Tallies
Worksheet Description
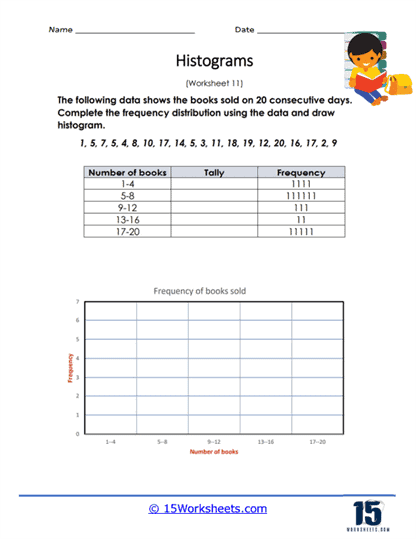
You are given raw data of the number of books that are sold over the course of 20 consecutive days. Take that raw data to create a tally chart. Then put all of this data into a histogram.
This worksheet is focused on creating a histogram based on sales data from a list of books sold over 20 consecutive days. The students are given a set of sales figures and a partially completed frequency distribution table with tally marks. They are required to complete the frequency distribution by tallying the given data and then use the completed table to draw a histogram on the provided grid, representing the number of books sold in different ranges.
The worksheet teaches students how to compile raw data into a frequency distribution table and then represent this data visually using a histogram. It reinforces skills in counting and tallying as well as in categorizing data into intervals. By drawing the histogram, students learn how to translate numerical information into a graphical format, which aids in the understanding and interpretation of data trends. This exercise enhances their ability to analyze quantitative information, a key competence in mathematics and statistics.