Complete the Table
Worksheet Description
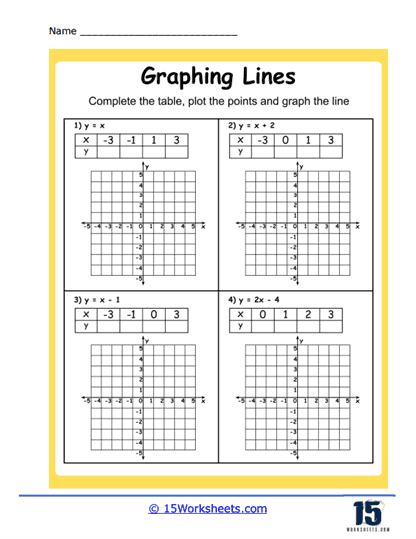
This worksheet comprises four problems, each designed to practice graphing linear equations. In each problem, a linear equation is given along with a table where students are expected to calculate and enter the corresponding y-values for given x-values. Once the table is complete, students must plot these points on the provided coordinate grid and then draw the line that connects them, representing the equation graphically. The equations provided are in the standard form y = mx + b, where m represents the slope and b represents the y-intercept.
The worksheet aims to teach students the process of creating a graph from a linear equation. It emphasizes understanding the relationship between the x and y values in an equation and how these relationships are represented visually on a graph. Students will learn to interpret the slope and y-intercept from the equation, plot the points accurately, and then draw the line. This activity helps to build critical graphing skills, which are foundational for algebra and further mathematics studies.