Visually Equivalent Fractions
Worksheet Description
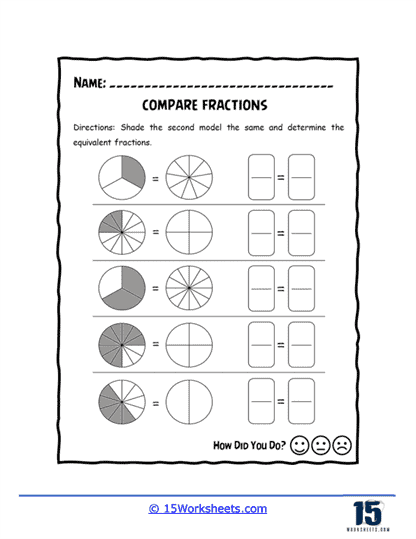
You will draw the equivalent fraction on the subsequent fraction model. You will then convert all these values to numeric fractions. This worksheet is designed to assist students in understanding the concept of equivalent fractions through visual representation. It features pairs of shapes, one of which is a pie chart partially shaded to represent a fraction, and the other is a blank shape. The task for students is to shade the second shape to match the fraction shown in the pie chart and then write down the equivalent fraction. This visual approach is intended to help students grasp the idea that different shapes can represent the same fractional value.
The worksheet teaches students that fractions are a way to represent parts of a whole and that these parts can look different while still being equal in size-this is the concept of equivalent fractions. By shading the equivalent portion in different shapes, students can visually see that the same fraction can be represented in multiple ways. This activity enhances the students’ understanding of how fractions work and prepares them for more complex operations involving equivalent fractions. The ultimate goal is to foster an intuitive understanding of equivalence in fractions, which is a key skill in mathematics.