Percentage of Favorite Pets
Worksheet Description
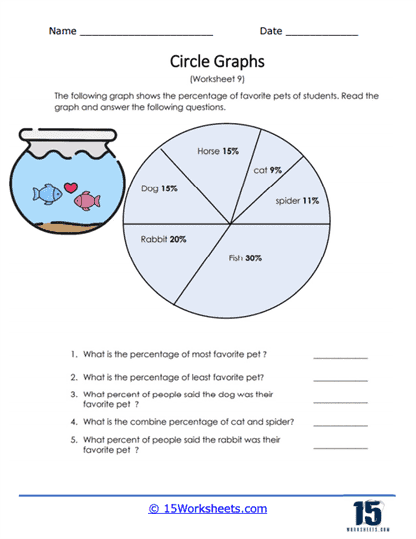
Students were asked their favorite type of pet. A circle graph is provided that displays the results of the survey. Answer all of the questions based on the graph. The worksheet presents a pie chart that illustrates the percentage of students’ favorite pets, including fish, rabbits, horses, dogs, cats, and spiders. Each segment of the pie chart is labeled with the corresponding percentage that reflects the preference for that pet among the students surveyed. The worksheet provides a set of questions that ask students to identify the most and least favorite pets based on the percentages, calculate the combined percentage of those who favor cats and spiders, and determine what percentage of students chose the dog as their favorite pet.
The worksheet is teaching students how to read and analyze data in a pie chart format. By answering the questions, students practice interpreting percentages and understanding how they represent parts of a whole in the context of the pie chart. The task of combining percentages for cats and spiders helps reinforce addition skills within the framework of data analysis. This exercise not only aids in improving mathematical reasoning regarding percentages but also in applying these concepts to real-life scenarios, such as survey results.