Outdoor Activities Graph
Worksheet Description
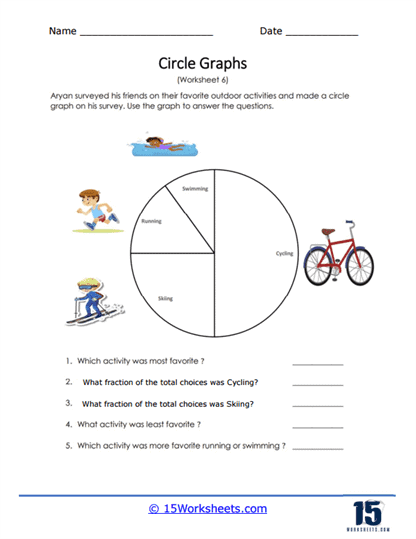
Aryan surveyed his friends. He asked them about the outdoor activities that they mostly participate in. The data collected is displayed in a circle graph. Answer the critical thinking questions based on the data that was collected.
This worksheets presents a pie chart resulting from Aryan’s survey on his friends’ favorite outdoor activities. The activities listed are running, swimming, cycling, and skiing, with each represented as a segment on the circle graph. Students are asked to use the graph to answer questions regarding the most and least favorite activities, as well as to determine the fraction of the total choices that each of the activities represents. This worksheet combines visual data representation with questions that require analytical thinking.
The worksheet is designed to teach students how to interpret data from a pie chart and understand fractions in a real-life context. It aims to develop skills in analyzing proportional relationships and expressing these relationships as fractions of a whole. Students are encouraged to compare different segments to determine popularity and to quantify preferences in terms of fractions. This not only helps students grasp the concept of fractions and proportionality but also aids in developing their ability to translate visual information into numerical data.