Making Shopping Circle Graphs

Worksheet Description
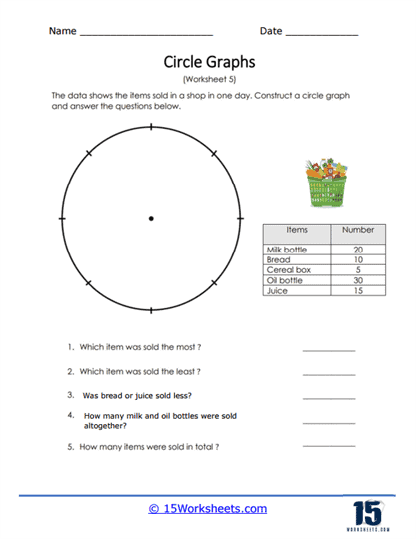
You are given numerical data about the items that were sold in a store over the course of a day. You will take the numeric data and create a pie chart. You will then use this graph and the data to answer a series of questions.
This worksheet provides sales data for various items in a shop on a specific day and includes a blank circle graph for students to fill in. The items sold are milk bottles, bread, cereal boxes, oil bottles, and juice, with the number of items sold next to each. Students are instructed to construct a circle graph based on the data provided and then answer questions regarding which item sold the most and least, comparisons between sales of different items, and the total number of items sold.
The worksheet is designed to teach students how to represent numerical data in a circle graph, also known as a pie chart. Through this exercise, students learn how to visualize and compare quantities, calculate proportions for the circle graph, and understand the concept of representing parts of a whole. It also helps to improve their skills in interpreting data and answering analytical questions based on their visual representation. This type of activity is important for developing mathematical literacy and data interpretation skills, which are useful in many areas of study and everyday life.
