Reptile Population Graph
Worksheet Description
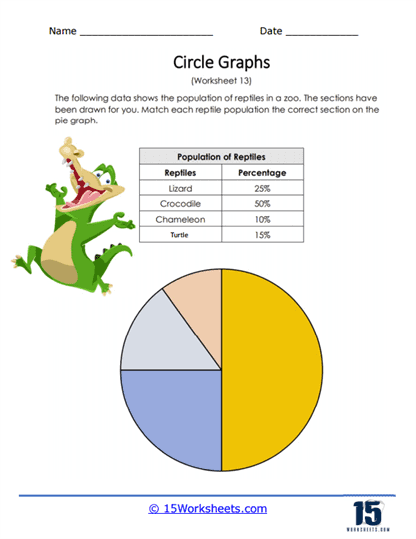
The following data shows the population of reptiles in a zoo. The sections have been drawn for you. Match the data to the correct sections of the pie graph.
This worksheet is an educational resource designed to help students learn about representing data through circle graphs, using the context of reptile populations in a zoo. The table on the worksheet lists various types of reptiles-lizards, crocodiles, chameleons, and turtles-and the corresponding percentage that each category constitutes of the total reptile population. A pie chart with colored sections is provided, but without labels. The task for the students is to associate each reptile category with the correct section of the pie chart, based on the percentage data given.
The worksheet aims to teach students how to interpret and represent statistical data visually using a pie chart. By assigning the task of matching pie chart sections to data, it reinforces the concept of percentages as parts of a whole and their visual representation in a circle graph. This activity enhances students’ abilities to analyze and compare proportions, and understand how these proportions are used in real-life scenarios to represent data. Additionally, it serves as a practical application of math skills in understanding natural science data, such as animal populations.