Pizza Toppings Pie Chart
Worksheet Description
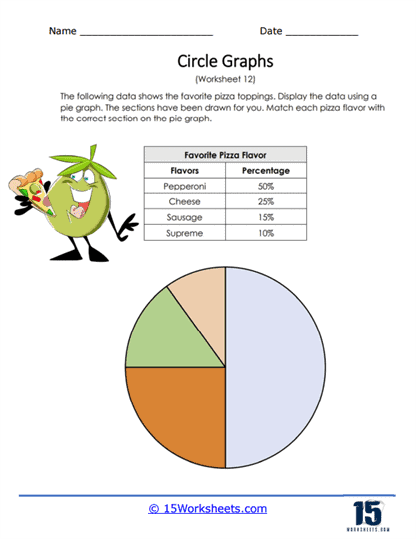
The data that is provided displays the favorite pizza toppings of students. Convert the data into a pie graph. This worksheet is an educational tool that focuses on teaching students about circle graphs, also known as pie charts, through the theme of favorite pizza flavors. It displays a table listing various pizza flavors along with the percentage that represents how much each flavor is favored. A partially completed pie chart is provided below the table, with segments already colored in but not labeled. The student’s task is to match each pizza flavor with the appropriate section of the pie chart according to the percentage given in the table.
The objective of this worksheet is to teach students how to convert percentage data into a visual representation in the form of a pie chart. It reinforces the understanding of percentages as parts of a whole and how they are depicted in a circular graph format, with each slice proportional to its percentage. This exercise helps in enhancing the students’ skills in interpreting and organizing data visually, which is a key component of data analysis. Moreover, it can also subtly introduce the concept of fractions, as each percentage represents a fraction of the total pizza flavors.