School Food Survey
Worksheet Description
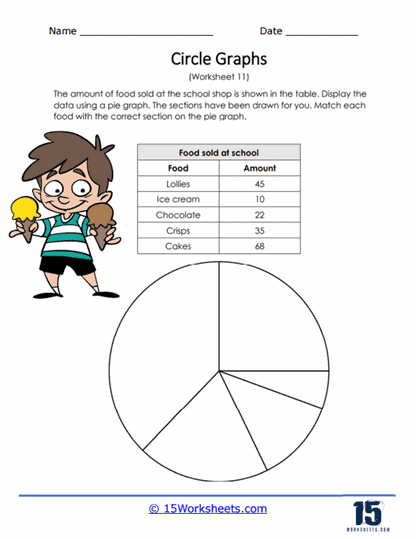
The data chart displays the number of each of the food items that were sold during a school day. Take the data and create a circle chart. Match the food items to the sections of the graph. This worksheet is a mathematics educational resource designed to teach students about circle graphs, often called pie charts. The worksheet presents a table of data representing the amount of different foods sold at a school shop, which includes items like lollies, ice cream, chocolate, crisps, and cakes, along with their respective quantities. Below the table is an incomplete pie chart with sections drawn but not labeled. The task for the students is to match each food item with the correct section on the pie chart based on the amounts provided.
The worksheet is intended to teach students how to interpret tabular data and represent it visually using a pie chart, which is a fundamental concept in data representation and interpretation. By completing the activity, students will practice calculating the proportion of each category in relation to the whole set of data and understand how these proportions translate into segments of a pie chart. This exercise also enhances the student’s ability to analyze data and improves their understanding of fractions and percentages, which are critical for many real-world applications.