Daily Activities Circle Graph
Worksheet Description
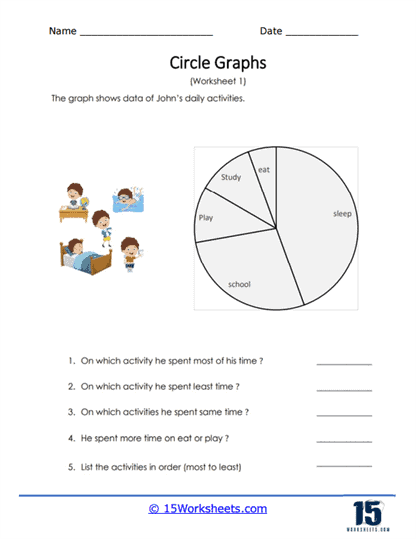
This circle (pie) graph displays the composition of John’s daily activities. Answer the following questions based on this data in the graph. We spend a lot of time sleeping and in school.
The worksheet features a pie chart representing John’s daily activities: study, eat, play, sleep, and school. Each slice of the pie chart corresponds to the proportion of time spent on each activity. Below the graph, a series of questions prompts students to analyze the chart to determine which activities take up the most and least of John’s time, identify activities sharing equal time, and compare the time spent on eating versus playing. The worksheet combines visual data representation with critical thinking questions to assess students’ understanding.
The worksheet is intended to teach students how to interpret and draw conclusions from data presented in a pie chart or circle graph. It helps students understand the concept of proportional representation, where the size of the pie slice correlates to the quantity or time associated with each activity. The exercise enhances their ability to compare and rank data visually, translating the abstract slices into tangible information. This type of graph is commonly used in various fields, making this skill valuable for students’ mathematical education and their ability to interpret real-world data.