Mr. Murray’s Class
Worksheet Description
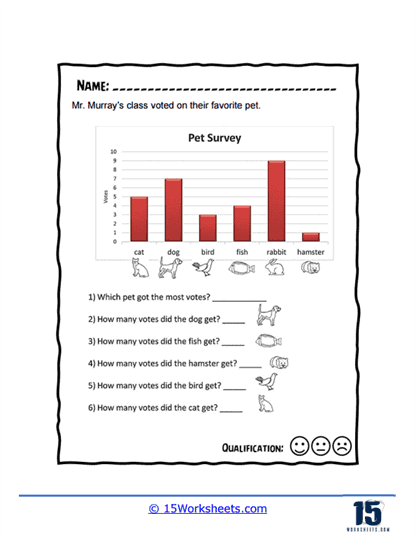
A different class was asked their favorite pet. The data is displayed on a vertical bar graph. It looks like rabbits are very popular in this particular class.
This worksheet depicts a bar graph titled “Pet Survey,” which illustrates the results of a vote by Mr. Murray’s class on their favorite pets. The graph includes categories for cat, dog, bird, fish, rabbit, and hamster, with bars of varying heights indicating the number of votes each pet received. Students are expected to analyze the graph and answer questions such as identifying which pet received the most and fewest votes and determining the exact number of votes for each pet type. The layout of the worksheet is designed to be straightforward, allowing students to directly correlate the height of each bar with the popularity of each pet.
The worksheet’s educational goal is to enhance the students’ ability to interpret and analyze data presented in a bar graph format. It teaches them to compare the sizes of the bars to determine relative quantities and to extract specific numerical information from the visual representation. By answering the questions provided, students practice critical thinking and numerical comparison, which are vital skills in data interpretation. Additionally, this type of exercise introduces students to the concept of conducting surveys and representing their results graphically, providing a foundation for more advanced statistical learning.