Shape Vertical Bars
Worksheet Description
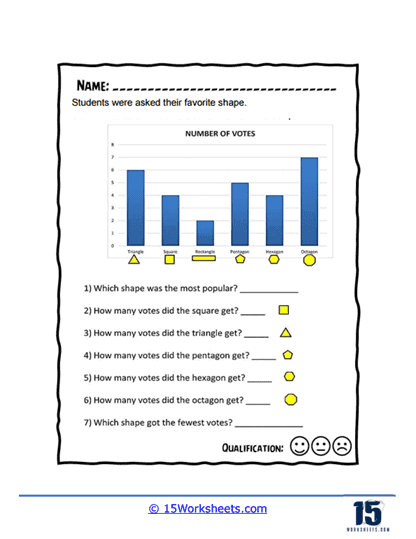
Students were asked their favorite shape. The bar graph was created from the data that was collected. Answer all of the questions based on this data.
The worksheet features a bar graph depicting the results of a survey in which students were asked about their favorite shape. The graph displays the number of votes each shape received, with shapes including squares, triangles, pentagons, hexagons, and octagons. Below the graph, there are questions for students to answer, such as identifying the most and least popular shapes and determining the exact number of votes for each shape. The worksheet is structured to engage students with the visual data presented and to encourage them to draw conclusions from it.
The worksheet is designed to teach students how to interpret bar graphs, an essential skill in data analysis. Through the provided questions, students practice identifying which bar corresponds to which shape, compare the heights of the bars to determine popularity, and translate the visual information into numerical answers. This activity enhances their understanding of how data can be represented visually and how to extract information from such representations. It also helps them to develop critical thinking skills by analyzing the data to answer specific questions.