Travelling to School Bar Graph
Worksheet Description
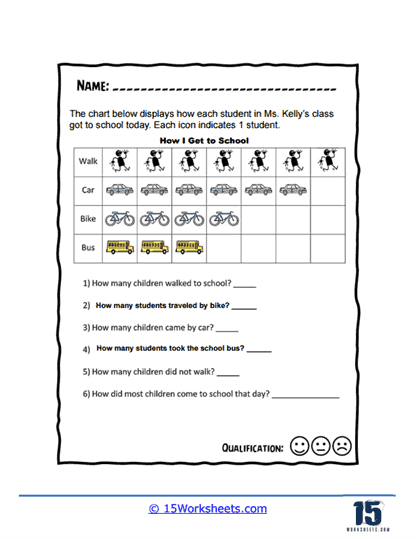
Ms. Kelly’s class was asked how they arrived at school today. Students used either their feet, a car, a bike, or a bus. It seems that most of the students live very close to the school building.
The worksheet provides a pictorial chart showing various modes of transport by which students in Ms. Kelly’s class get to school. The chart categorizes the modes of transportation into walking, car, bike, and bus, with each icon representing one student’s choice of transport. Students are tasked with interpreting the chart to answer questions about the number of children using each mode of transport and to identify which modes of transport were not used. The exercise combines visual interpretation with quantitative assessment to determine how students in the class commute.
This worksheet aims to teach students how to read and interpret data from a pictogram. By translating the visual representation of icons into numerical data, students practice basic counting and simple data analysis. The activity helps develop their ability to process visual information and convert it into meaningful statistics. It also introduces students to the concept of data representation and encourages them to think about how different forms of data can be used to convey information in an easily understandable way.