Horizontal Weather Bar Graph
Worksheet Description
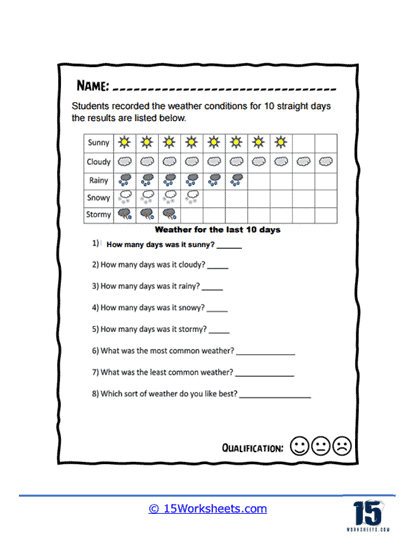
Students recorded the weather conditions for 10 straight days. The results of these records are presented in a Horizontal boxed bar graph. You will use this data to answer a series of questions.
The worksheet is a simple data collection and analysis activity centered around weather observation. It displays a chart that records the weather conditions for 10 consecutive days, with symbols representing different weather types: sunny, cloudy, rainy, snowy, and stormy. Each row corresponds to a type of weather, and the symbols across the row indicate the days that particular weather was observed. Below the chart, there are questions prompting students to analyze the data, such as counting the number of days for each weather condition, identifying the most and least common weather, and expressing a personal preference.
The worksheet is aimed at teaching students the basics of data collection, representation, and analysis. It introduces them to the concept of tallying and interpreting information presented in a simple chart format. Through this exercise, students practice counting and comparing quantities, which are foundational skills in mathematics and statistics. Additionally, the worksheet encourages students to engage with the data personally by asking them about their weather preferences, thereby making the learning experience more relatable and interactive.