School Subjects Graph
Worksheet Description
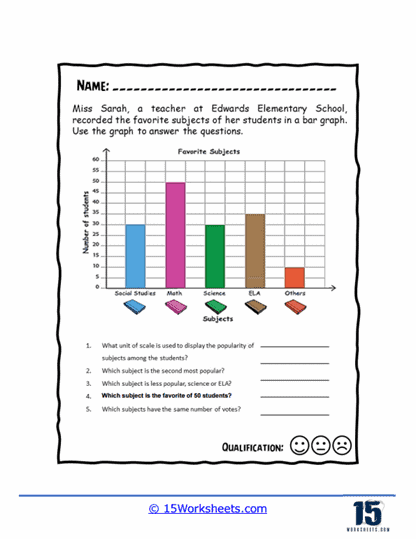
Miss Sarah recorded the favorite subjects of her students on this bar graph. Answer the series of questions about all the data that she complied into a bar graph.
The worksheet features a bar graph that represents the favorite school subjects of students from Edwards Elementary School, as recorded by a teacher named Miss Sarah. The subjects-Social Studies, Math, Science, ELA (English Language Arts), and Others-are displayed on the horizontal axis, with the number of votes for each subject represented by the height of the bars on the vertical axis. Students using this worksheet are asked to analyze the graph and answer specific questions listed below the graph. These questions are designed to guide students through interpreting the information presented in the graph, such as determining which subject is most or least popular, the scale of the graph, and comparisons between the subjects.
The worksheet is designed to teach students how to read and interpret bar graphs, a key skill in understanding data. By answering the questions, students learn to extract information such as identifying trends, comparing quantities, and understanding the scale and distribution of data. The activity reinforces the application of mathematics to real-world scenarios, showing how graphs can be used to summarize preferences or opinions in a visual format. It also helps students to develop critical thinking skills as they analyze the data and draw conclusions from the graphical representation.