My Pets
Worksheet Description
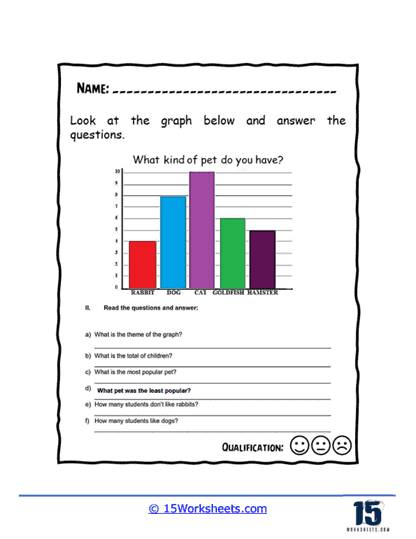
Students were surveyed as to the pets that they have at home. You will analyze the graph and answer questions about the data. Students report as having the following pets: dogs, cats, goldfish, hamsters, and rabbits.
The worksheet contains a bar graph with the title “What kind of pet do you have?” and aims to assess students’ abilities to interpret data from the graph. The graph depicts various pets-such as rabbits, dogs, cats, and goldfish-along with the number of children owning each type of pet, represented by the height of each bar. Students are prompted with questions about the theme of the graph, the total count of children represented, and specifics regarding the most and least popular pets. Additional questions target understanding of the numerical data corresponding to individual pets, like the number of students owning dogs and rabbits.
The purpose of this worksheet is to teach students how to extract and process information from a bar graph. It encourages them to understand the concept of data representation through visual means and to deduce answers to questions by comparing the lengths of the bars. This exercise is fundamental in developing skills related to data interpretation, critical thinking, and numerical comparison. Additionally, it serves as a practical application of mathematics, showing students how graphs can be used to summarize and convey information about real-world situations.