Vertical Pets Survey
Worksheet Description
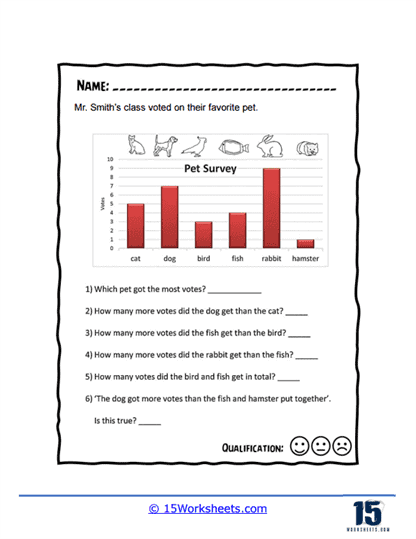
Mr. Smith had his class tell him their favorite pets. A bar graph was put together to display this data. Answer all of the questions when you breathe in the bar graph.
The worksheet features a bar graph titled “Pet Survey,” displaying the results of Mr. Smith’s class voting on their favorite pet. Various pets are listed along the horizontal axis, including a cat, dog, bird, fish, rabbit, and hamster, with the number of votes for each represented by the vertical bars. Students are prompted to answer questions based on the graph, such as identifying which pet received the most votes, comparing the number of votes different pets received, and performing simple addition to find the total votes for selected pets.
The worksheet teaches students how to interpret data from a bar graph, a key component of data literacy. It encourages them to compare quantities visually and numerically, enhancing their analytical skills. By engaging with the questions, students practice fundamental mathematical operations like subtraction and addition within a real-world context. The worksheet also tests students’ ability to verify statements about the data, developing their critical thinking skills as they assess and interpret information presented graphically.