Vertical Shapes Survey
Worksheet Description
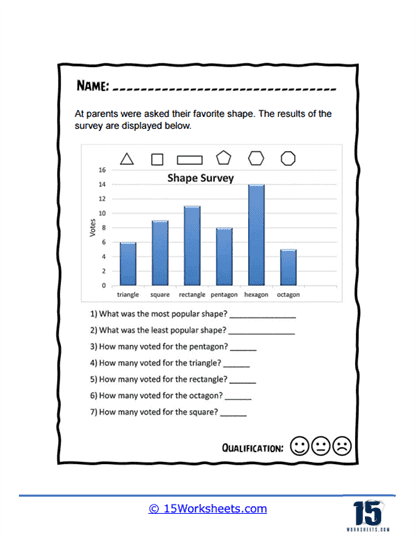
Parents were asked their favorite shape and the data was compiled into a vertical bar graph. Answer the questions based on this bar graph.
The worksheet presents a bar graph titled “Shape Survey,” which shows the results of a survey where adults were asked about their favorite geometric shape. The graph includes bars of varying heights corresponding to the number of votes received by each shape: triangle, square, rectangle, pentagon, hexagon, and octagon. Below the graph, there are questions for the students to answer based on the data, such as determining the most and least popular shapes and quantifying how many votes each shape received. This visual and interactive approach is designed to facilitate the students’ understanding of data representation in a bar graph format.
The worksheet is aimed at teaching students how to analyze and interpret data from a bar graph. By answering the questions, students practice skills such as identifying the highest and lowest bars to determine the popularity of items, reading the vertical axis to quantify votes, and comparing the lengths of bars to make relative assessments. This activity is crucial for building foundational skills in data literacy, which includes understanding how information can be graphically represented, compared, and summarized. Furthermore, the exercise helps students to develop numerical literacy by translating visual data into exact counts.