Bug Hunt Bars
Worksheet Description
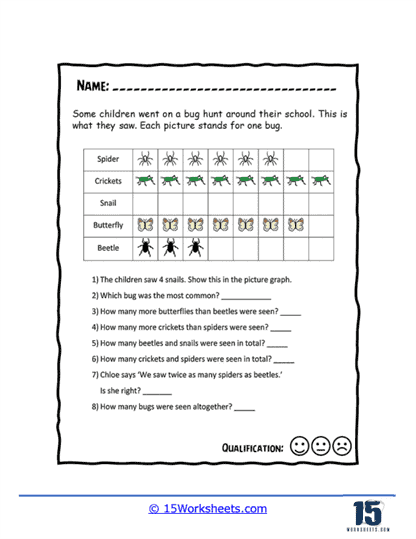
Some children went on a bug hunt around their school. The horizontal graph visualizes all of the insects that they located. Students will answer critical thinking questions based on this data.
This worksheet is about a pictogram that records the number of different bugs seen by children during a bug hunt around their school. Each icon in the pictogram represents one bug, and the types of bugs listed are spiders, crickets, snails, butterflies, and beetles. The students are given a series of questions that require them to interpret the pictogram, such as indicating the number of a certain type of bug seen or determining which bug was the most common. The worksheet is designed to be interactive, encouraging students to engage with the data and make observations based on the pictogram.
The worksheet is intended to teach students how to interpret and analyze data presented in a pictogram. It helps them practice counting and simple addition by tallying the number of icons, as well as comparative analysis to determine which category has the most or least number of items. The questions also encourage critical thinking by asking students to verify statements based on the data (like whether one type of bug was seen twice as often as another) and to sum up totals across categories. This exercise is fundamental for developing skills in visual data interpretation and basic statistical reasoning.