Tallest Tower Bar Graph
Worksheet Description
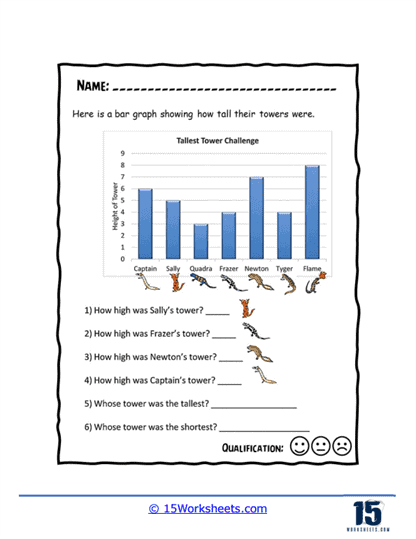
A number of different animals were challenged to create towers. The data on this vertical bar graph displays the height of each animal’s tower. You will answer questions about this data.
This worksheet presents a bar graph titled “Tallest Tower Challenge,” showing the heights of towers built by different individuals named Captain, Sally, Quadra, Frazer, Newton, Tyler, and Flame. The bars represent the height of each tower in units, and the names are listed along the horizontal axis. Students are tasked with using the bar graph to answer questions about the height of specific towers and to identify which is the tallest and shortest among them. The worksheet is designed to engage students with a practical application of bar graph interpretation in a competitive context.
The worksheet teaches students how to read and interpret data from a bar graph, a key skill in understanding graphical representations of information. Through this exercise, students learn to associate the height of the bars with numerical values and to compare these values to answer questions about the data. It enhances their ability to analyze and draw conclusions from visual data, encouraging attention to detail and critical thinking. Moreover, the competitive angle of the “Tallest Tower Challenge” adds an element of fun to the learning process, making the activity more enjoyable for the students.