Fraction Matching
Worksheet Description
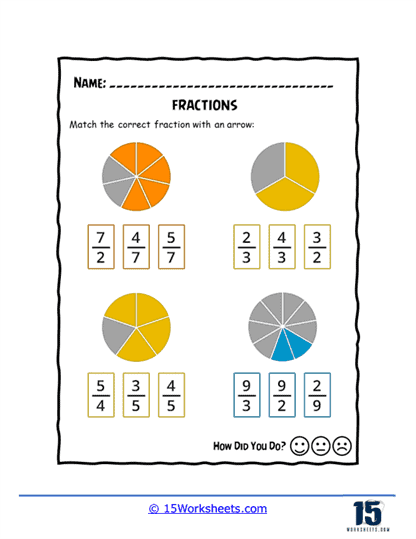
Match the colored (non-gray) portion of the pie diagrams to the fraction it represents. The worksheet is a matching activity designed for students to connect visual representations of fractions with their numerical form. Each section of the worksheet contains a colored pie chart with a certain number of segments shaded to represent a fraction, alongside a set of three numerical fractions. Students are expected to match the correct numerical fraction to its corresponding pie chart by drawing an arrow from the fraction to the pie chart. A “How Did You Do?” section with emoticons is provided at the bottom for self-assessment.
This worksheet is teaching students to identify fractions visually and match them with their numerical counterparts. It emphasizes the understanding of fractions as parts of a whole by showing how many parts of a circle are shaded compared to the total number of equal parts into which the circle is divided. By matching the visual fractions to their numerical expressions, students practice recognizing fractions beyond just numbers and develop a more intuitive sense for the size and proportion that fractions represent. This exercise also encourages the development of comparison skills as students must discern between similar-looking pie charts to find the exact match.