Football Goals Scored
Worksheet Description
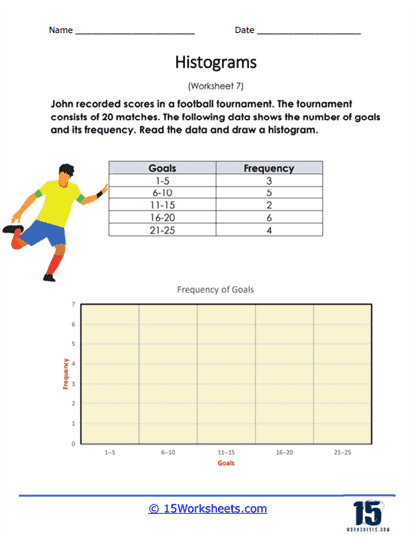
The frequency chart displays the number of goals scored by teams over the course of 20 matches in a tournament. Take this data and create a visual histogram to help you better understand the data that was collected.
This worksheet is a task involving the creation of a histogram based on provided sports data. It details the number of goals scored in ranges during a football tournament that spanned 20 matches. The data is presented in a table format with goal ranges as intervals and their corresponding frequencies. Students are asked to read this tabulated data and construct a histogram on the provided blank graph, correctly plotting the frequency of goals against the goal ranges.
The worksheet aims to teach students how to visually represent statistical data through a histogram. It instructs them on how to interpret a frequency table and convert it into a bar graph, where each bar’s height corresponds to the number of occurrences within specific intervals of data. This exercise helps students grasp the concept of data distribution and the skill of graphically summarizing large data sets. By completing the histogram, students will enhance their understanding of data analysis and their ability to communicate information effectively through graphs.