Village Population Histogram
Worksheet Description
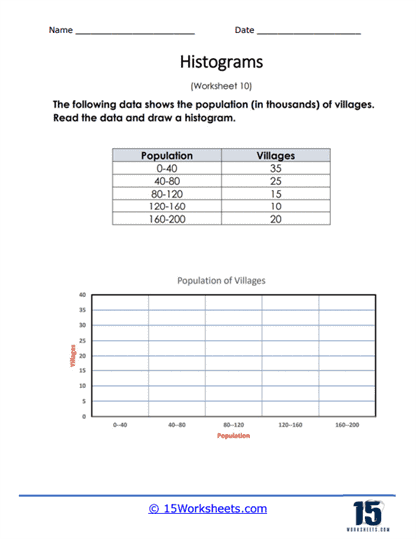
Students are given a data table that shows the population frequency of villages in a geographic area. You will take that data to create your own histogram.
This worksheet provides data on the population of villages, expressed in thousands, segmented into different ranges. The provided table lists these ranges alongside the number of villages falling into each population category. Students are instructed to use this data to create a histogram by plotting the number of villages on the vertical axis against the corresponding population ranges on the horizontal axis. The task is designed to transform the tabular data into a visual format, making the distribution of village populations easy to understand at a glance.
The worksheet is intended to teach students how to construct and interpret histograms, which are graphical representations of frequency distributions. It allows students to practice determining the appropriate scale for the graph and drawing bars to correspond with the number of villages in each population category. This exercise is important for developing skills in data representation and helps students to visualize and better understand the distribution of a given dataset. By completing this worksheet, students enhance their ability to analyze and present statistical data.