Frequency to Tally to Histogram
Worksheet Description
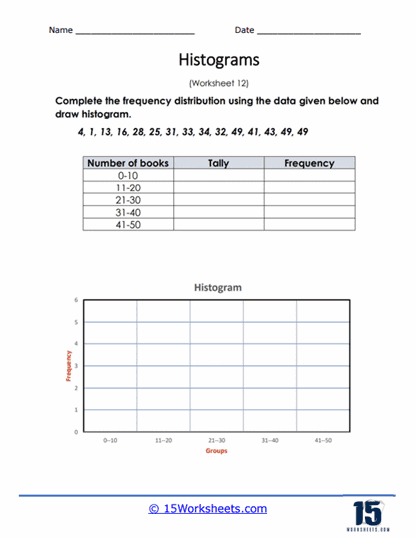
You are given a selection of raw data that you will use to create a frequency distribution. From all that data you will make a histogram.
This worksheet is designed for students to practice organizing data into a frequency distribution and then to create a histogram based on that distribution. A series of numbers representing the number of books is provided, which students must tally into the appropriate numerical ranges indicated in the frequency table. Once the frequency distribution is completed, students are instructed to draw a histogram on the chart below, with the horizontal axis representing the range groups and the vertical axis representing the frequency of the number of books.
The worksheet aims to teach students how to analyze a set of data and categorize it into a frequency distribution table, a fundamental skill in handling statistical information. It also instructs students on how to visually represent this data by constructing a histogram, which is a type of bar chart. Through this activity, students learn to recognize patterns within data sets and understand how to communicate this information graphically. This practice is important for developing their ability to interpret and present data, critical skills in math and science education.