Tally Frequency Distribution
Worksheet Description
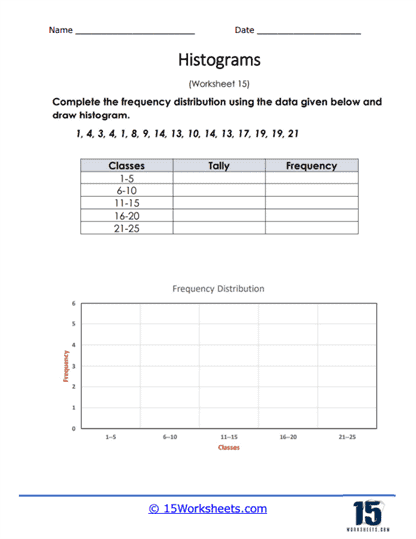
You are given a selection of data that you will first tally. You will then analyze this to create a frequency distribution chart. Take that data and plot it into a histogram. This all about preparing the data to make better choices based on the data that was collected.
This worksheet presents students with the task of creating a histogram based on a given set of data. The data consists of numerical values that students must categorize into predefined classes and tally to determine their frequencies. The provided table for tallying and frequency needs to be completed with this information. Once the table is filled out, students must then use the frequencies to draw a histogram on the blank graph below, with the horizontal axis representing the classes and the vertical axis indicating the frequency of each class.
The worksheet is teaching students how to organize raw data into a frequency distribution and then visually represent that distribution through a histogram. It requires students to apply counting skills to tally the data, determine the frequency of each class, and then translate numerical information into a graphical form. This exercise helps students to understand the concept of distribution and gives them practice in creating a type of chart commonly used in statistics. The ability to interpret and construct histograms is a valuable skill for analyzing and presenting data in many academic and professional fields.