Weekly Graph
Worksheet Description
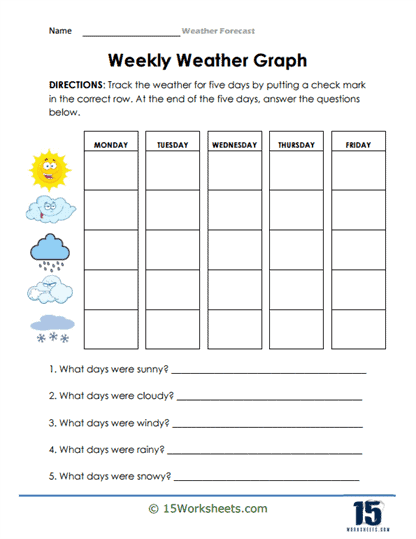
This worksheet is titled “Weekly Weather Graph” and is designed to help students track weather conditions over the course of a week. It features a table with columns for each weekday, Monday through Friday, and rows with symbols representing different weather conditions such as sunny, cloudy, windy, rainy, and snowy. Students are instructed to monitor the weather daily and place a check mark in the corresponding row based on the observed weather. At the end of the week, there are questions prompting students to reflect on the weather patterns they recorded, such as identifying which days were sunny or rainy.
The worksheet aims to teach students about weather observation and recording data in a structured format. By tracking the weather, students learn to identify and differentiate between various weather conditions. The activity also introduces them to the basics of data collection and how to represent information visually using a graph. Additionally, by answering questions about the week’s weather, students enhance their analytical skills as they review and interpret the data they have collected.