Graphing Veggies
Worksheet Description
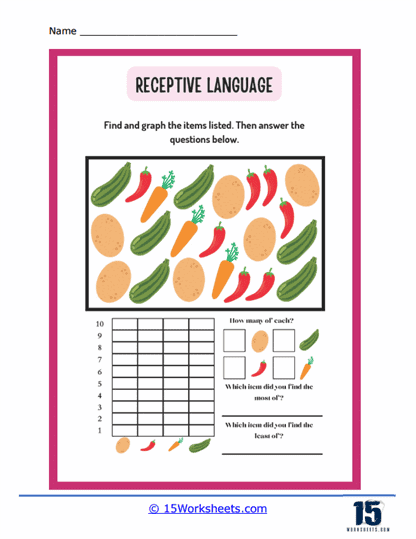
This worksheet combines counting with basic data representation. Students are presented with a collection of food items – cookies, cucumbers, and chili peppers – scattered across the page. They are tasked with finding and counting each type of item and then recording the quantities on a bar graph provided. Additionally, there are questions below the graph where students must reflect on their findings, such as identifying which item they found the most and least of.
The worksheet educates students on how to conduct a simple count of items and translate that information into a visual graph format. It teaches the fundamentals of data collection and representation, a key skill in both math and science education. By asking students to identify the most and least common items, it also introduces them to basic concepts of data analysis. Moreover, this activity promotes attention to detail and comparative reasoning, as students must distinguish between different items and compare their frequencies.