Car Graph
Worksheet Description
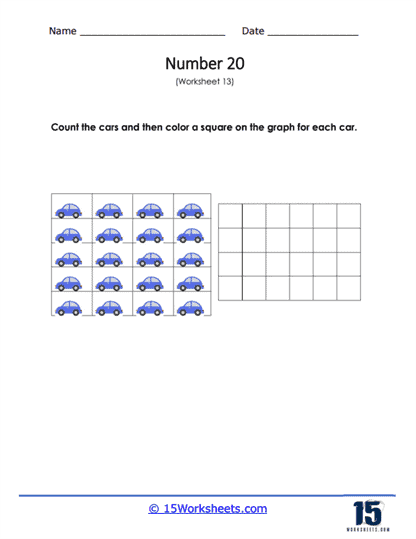
This worksheet features an array of cars and a blank graph next to it. The task for the students is to count the number of cars presented in the array and then color a square on the graph corresponding to each car. The cars are arranged in rows, making it easier to count them systematically. Once counted, students use the graph to create a visual representation of the total number of cars by coloring the squares.
The purpose of this worksheet is to teach students basic counting skills and introduce them to data representation through graphing. By counting the cars, students practice their counting ability and learn to correlate quantities with visual representation. Coloring the graph to represent each car helps them understand the concept of one-to-one correspondence and introduces them to the basics of creating bar graphs, which are foundational skills in data interpretation and mathematics.