Color Division Chart
Worksheet Description
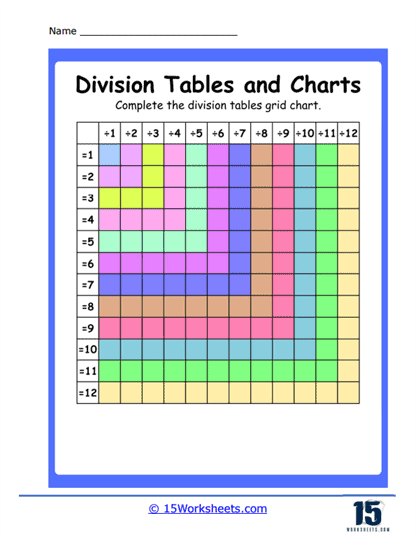
This worksheet features a colorful grid that represents a division table chart for numbers 1 through 12. Each row and column header is labeled with a number, and each cell within the grid is meant to be filled in with the result of dividing the column number by the row number. The varied colors across the grid help to visually segment the different divisions for clarity. It’s a blank template that requires students to calculate and fill in the results to complete the division table.
The objective of this worksheet is to teach students how to calculate division problems systematically and to help them memorize division facts for numbers 1 through 12. By completing this chart, students can visualize the relationships between numbers in division and better understand the concept of division as the inverse of multiplication. This type of exercise is critical in building foundational math skills, particularly in preparing students for more complex mathematical tasks that involve division. The use of colors helps to break down the table into smaller sections, making the task less daunting and aiding in the learning process.