Diagram Delights
Worksheet Description
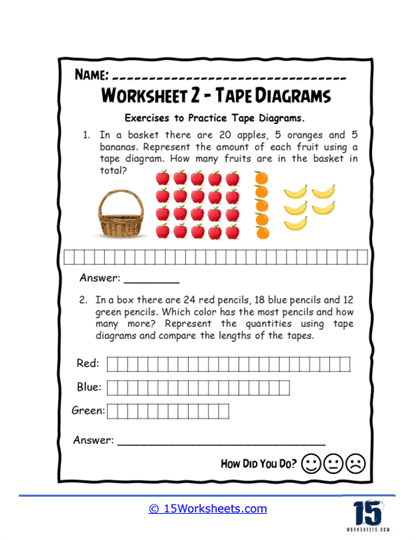
The worksheet is a vibrant worksheet designed to introduce students to the concept of tape diagrams through engaging scenarios involving fruits and colored pencils. The first task challenges students to visualize the quantities of apples, oranges, and bananas in a basket using a tape diagram, helping them to see the total amount of fruit at a glance. The second task switches to a classroom setting where students compare quantities of red, blue, and green pencils, identifying which color is most numerous. Each exercise employs tape diagrams to help students visually compare and understand different quantities effectively.
This worksheet aims to develop students’ skills in using tape diagrams to represent and compare quantities visually. By presenting real-world scenarios such as counting fruits and pencils, it helps students understand the practical application of mathematical diagrams in everyday situations. The tasks are designed to enhance students’ counting skills and to foster their ability to analyze and interpret data through visual means. Additionally, by engaging with these activities, students are encouraged to practice arithmetic operations like addition and subtraction in a context that promotes critical thinking and problem-solving.