City Temperatures
Worksheet Description
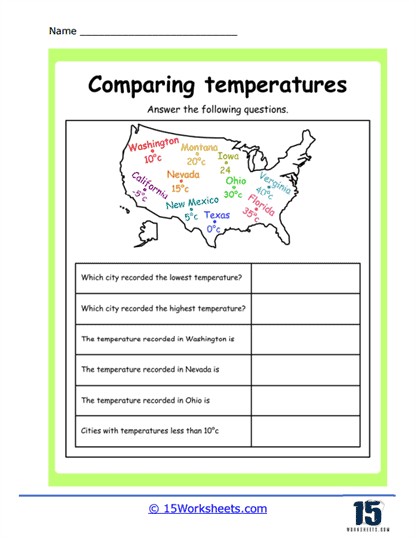
This worksheet is centered on a temperature comparison task using a map of the United States. The map displays various cities along with their corresponding temperatures in degrees Celsius. Students are prompted by questions to identify which city has the lowest and highest temperature, to record specific temperatures for certain cities, and to list cities that have temperatures below a given threshold. The exercise requires students to examine the map, interpret the temperature data, and use that information to answer the questions.
The goal of this worksheet is to develop students’ abilities to analyze and compare numerical temperature data within a geographical context. It aims to enhance their understanding of how temperatures can vary between different locations and the factors that may influence these variations. The activity also encourages the practice of identifying specific data points and categorizing information based on numerical criteria. Through this task, students integrate skills from science, mathematics, and social studies, promoting an interdisciplinary approach to learning.