Infographics

Worksheet Description
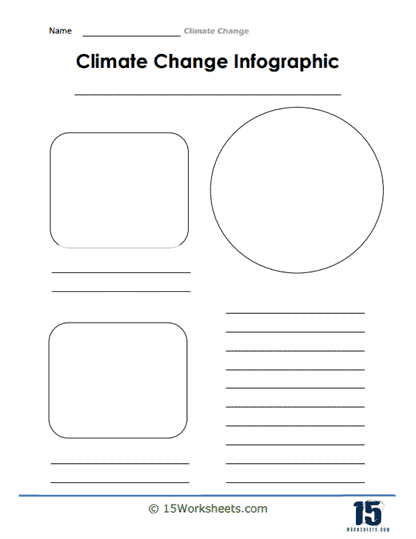
This gives you a worksheet that can inspire a student to create an infographic to support Climate Change. The worksheet offers a blank template that enables students to design and structure a visual representation centered around the theme of climate change. The layout contains two square placeholders, presumably for images or diagrams, and a larger circular space which could be utilized for central facts or a key visualization. Additionally, there are multiple lined sections provided for descriptive text, captions, or important data.
To adeptly utilize this worksheet, students should first identify the primary information or message they wish to convey about climate change. After sourcing relevant images or diagrams, they can be placed within the square placeholders to visually support their chosen topic. The central circle can be used for highlighting the core message, major statistics, or even a chart. The lined sections serve as spaces for explanatory text, where students can offer context, elaborate on the visuals, or list pertinent facts about climate change.
This worksheet endeavors to cultivate the ability of students to communicate complex information in a visually appealing and easily digestible manner. By designing an infographic, students learn the importance of balancing text with imagery, ensuring clarity, and prioritizing information. It pushes them to think critically about data presentation and how best to engage an audience. Ultimately, the goal is to equip students with the skills to effectively convey the urgency and intricacies of climate change to a wider audience through impactful visual storytelling.
